Technical Analysis28 October 2026 · 5 min read · By the Mahira Capital team
Technical Analysis for Beginners: Where to Start
Charts look like a foreign language until somebody shows you the alphabet. Here is a sane order in which to learn it — candles first, opinions last.
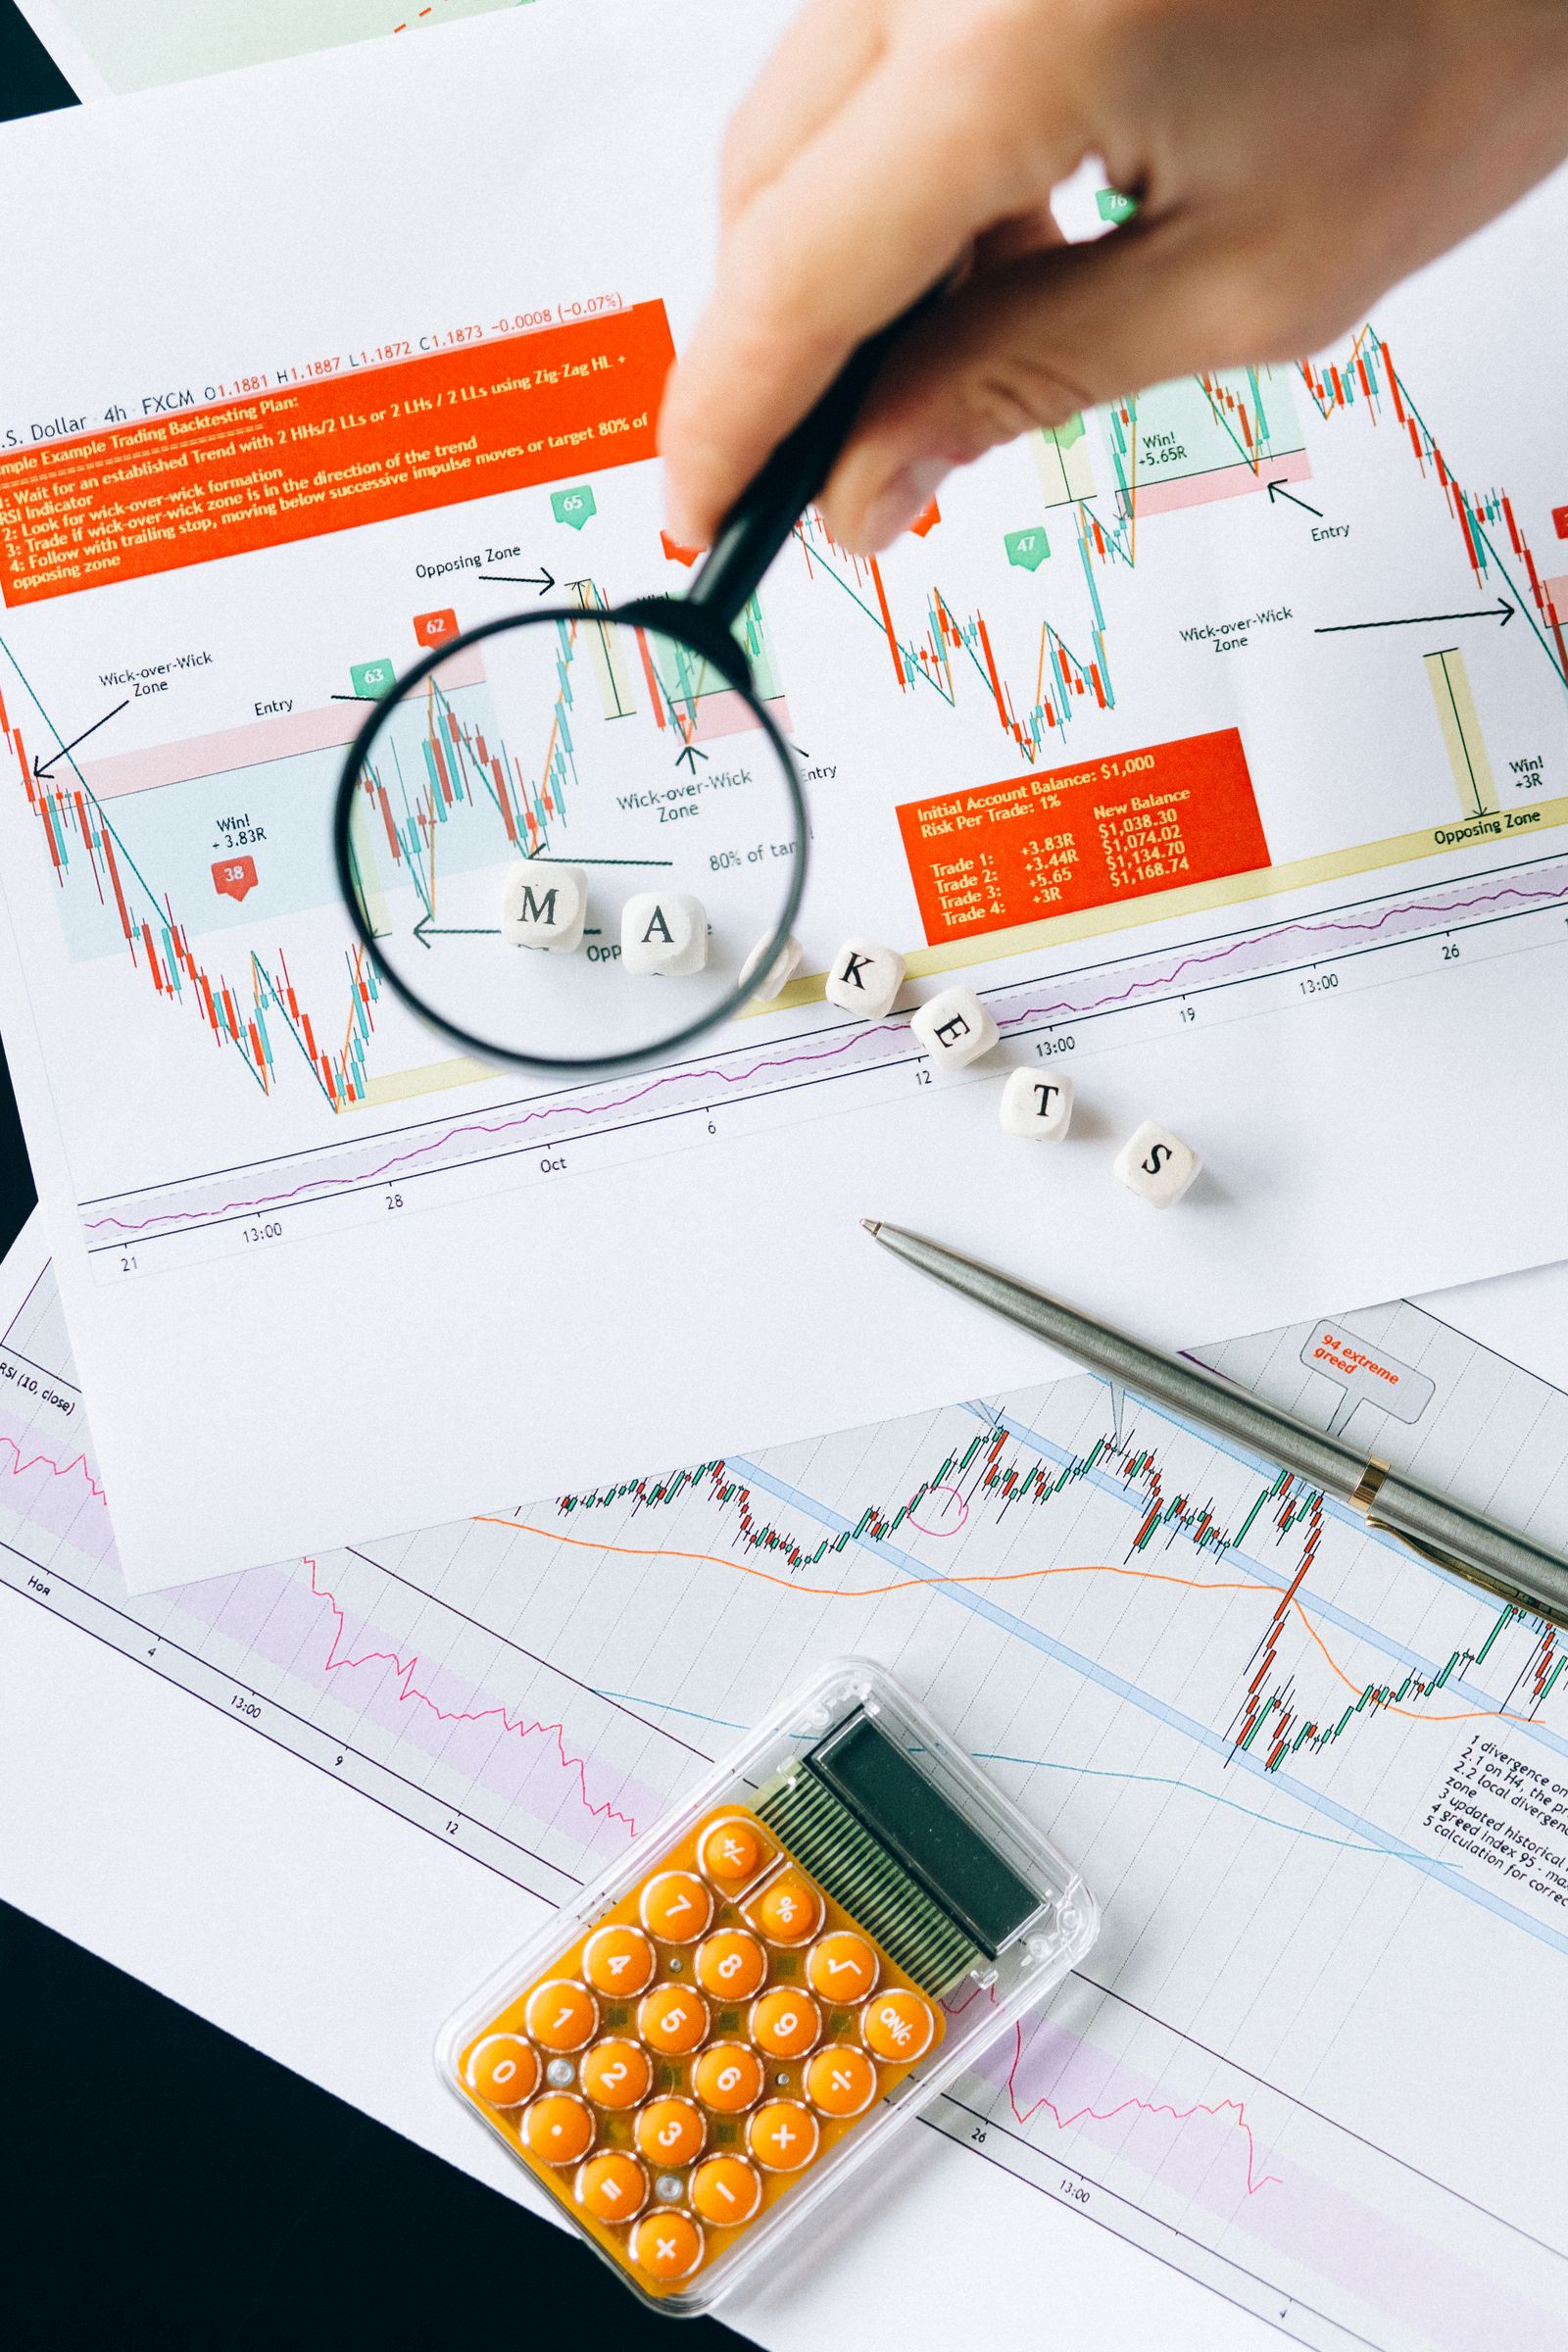
Open any trading screen for the first time and the honest reaction is: this is a lot. Candles, lines, coloured bands, numbers changing colour — it looks like the control panel of a machine you are not licensed to fly. The good news is that technical analysis has an alphabet, and it is short. The discouraging charts you see online are written by people who learned the alphabet years ago and now write poetry. Start with the letters.
Step one is the candlestick itself. A candle compresses four prices — open, high, low, close — into one small picture of who won a period of trading. Our shelf starts there too: Candlestick Patterns, Explained Simply spends its first chapters on single candles before it ever names a pattern, because a pattern you cannot decompose is just a shape you are superstitious about.
Step two is trend. Before indicators, before patterns, learn to say one honest sentence about a chart: is it going up, down, or sideways, and over what period? Moving averages and trendlines — the subject of Rohan Khanna's companion volume — exist to help you answer exactly that question without squinting. If the answer is 'sideways', most tools stop working, and knowing that early will save you real money.
Step three, and only then, is everything else: support and resistance, volume, an indicator or two. Add tools in the order of the questions they answer, one at a time, and live with each for a few weeks of chart-reading before adding the next. A screen with three tools you understand beats a screen with twelve you merely recognise.
A last word on method. Technical analysis is a way of describing what price has done; it is not a way of knowing what price will do. Study it the way you would study weather maps — to read conditions honestly, not to demand forecasts. The learners who last are the ones who treat every chart as a description and every certainty as a warning sign. Start with one candle. The rest is vocabulary.
Enjoying the blog?
Every book mentioned here is in the store — most under ₹350, delivered instantly.
Browse the Store